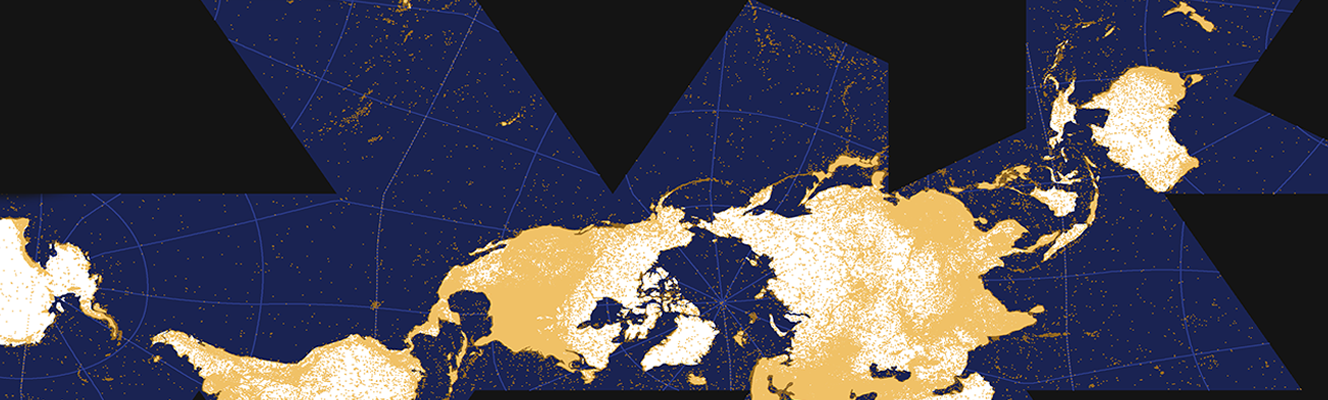
(Click to see full image)
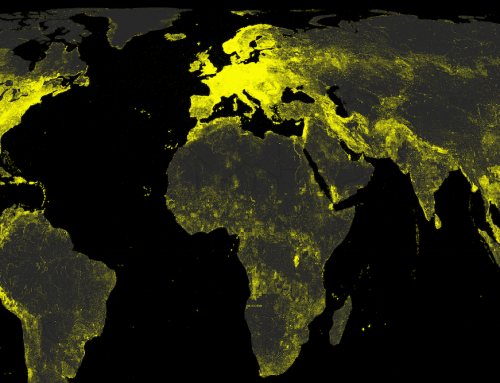
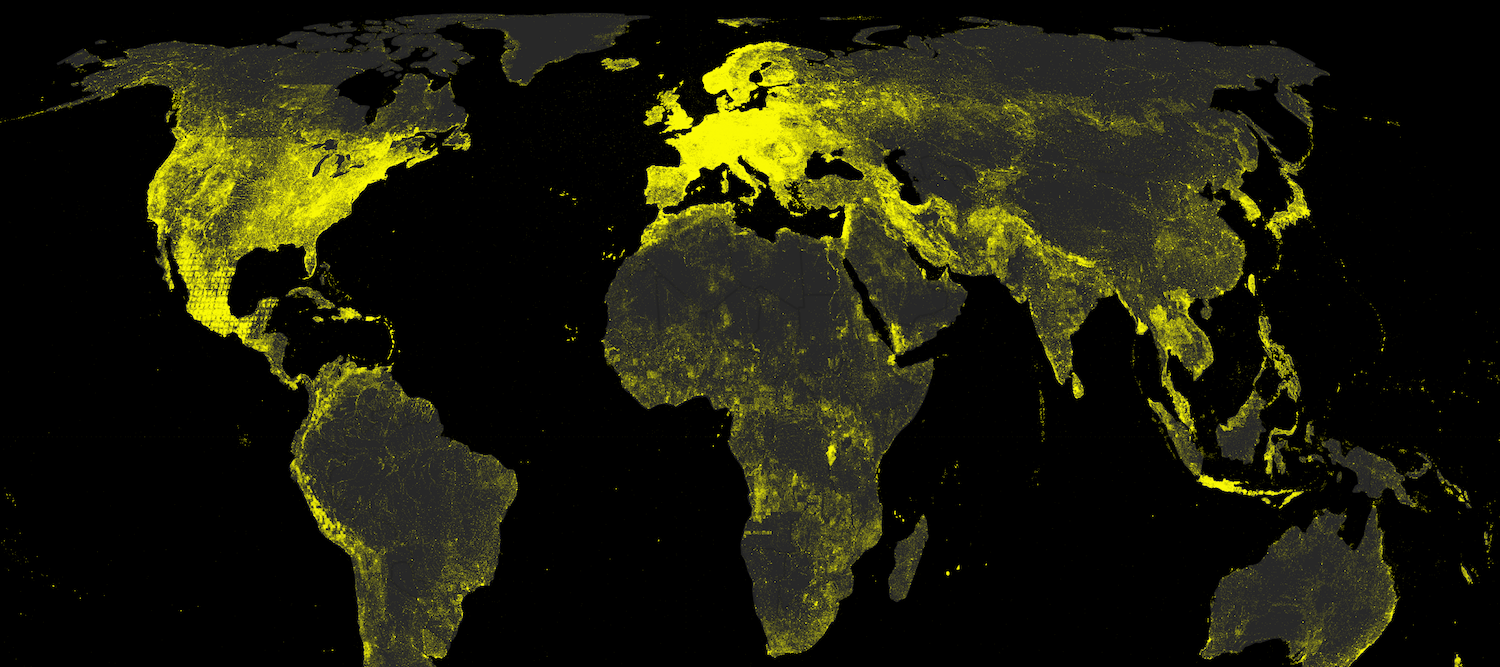
This graphic illustrates the number of events listed in the Global Database of Events, Language, and Tone, from January 1979 until August 5th, 2013. The database is a compiled from stories in media outlets from almost every country on Earth.
Data
The map uses data from the Global Database of Events, Language, and Tone (GDELT), which is an initiative aiming to provide a “realtime social sciences earth observatory”, by creating a freely available catalog of events derived from news stories. Any story can contain more than one event, and events are automatically parsed out of news stories from different sources using a text analysis program called Tabari and encoded using a schema called Cameo.
A large portion of these events (140 million out of the 250 million listed) contain both a location of where the event happened and locations of the two primary actors involved. The Tabari algorithm associates events that it has already picked out of an article with geographic locations mentioned in the same text, by looking at verb usage in surrounding sentences. You can read the introductory paper on GDELT (Leetaru and Schrodt, 2013) for more on the specific geocoding methods employed.
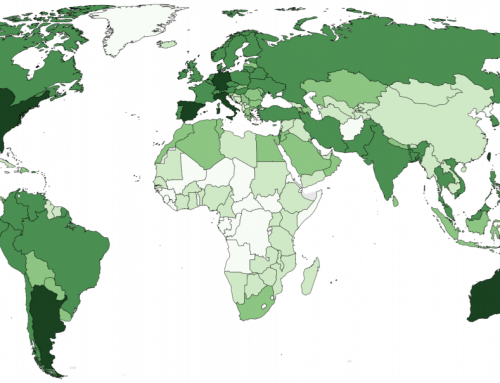
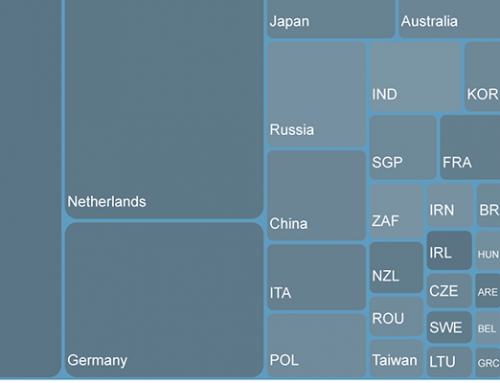
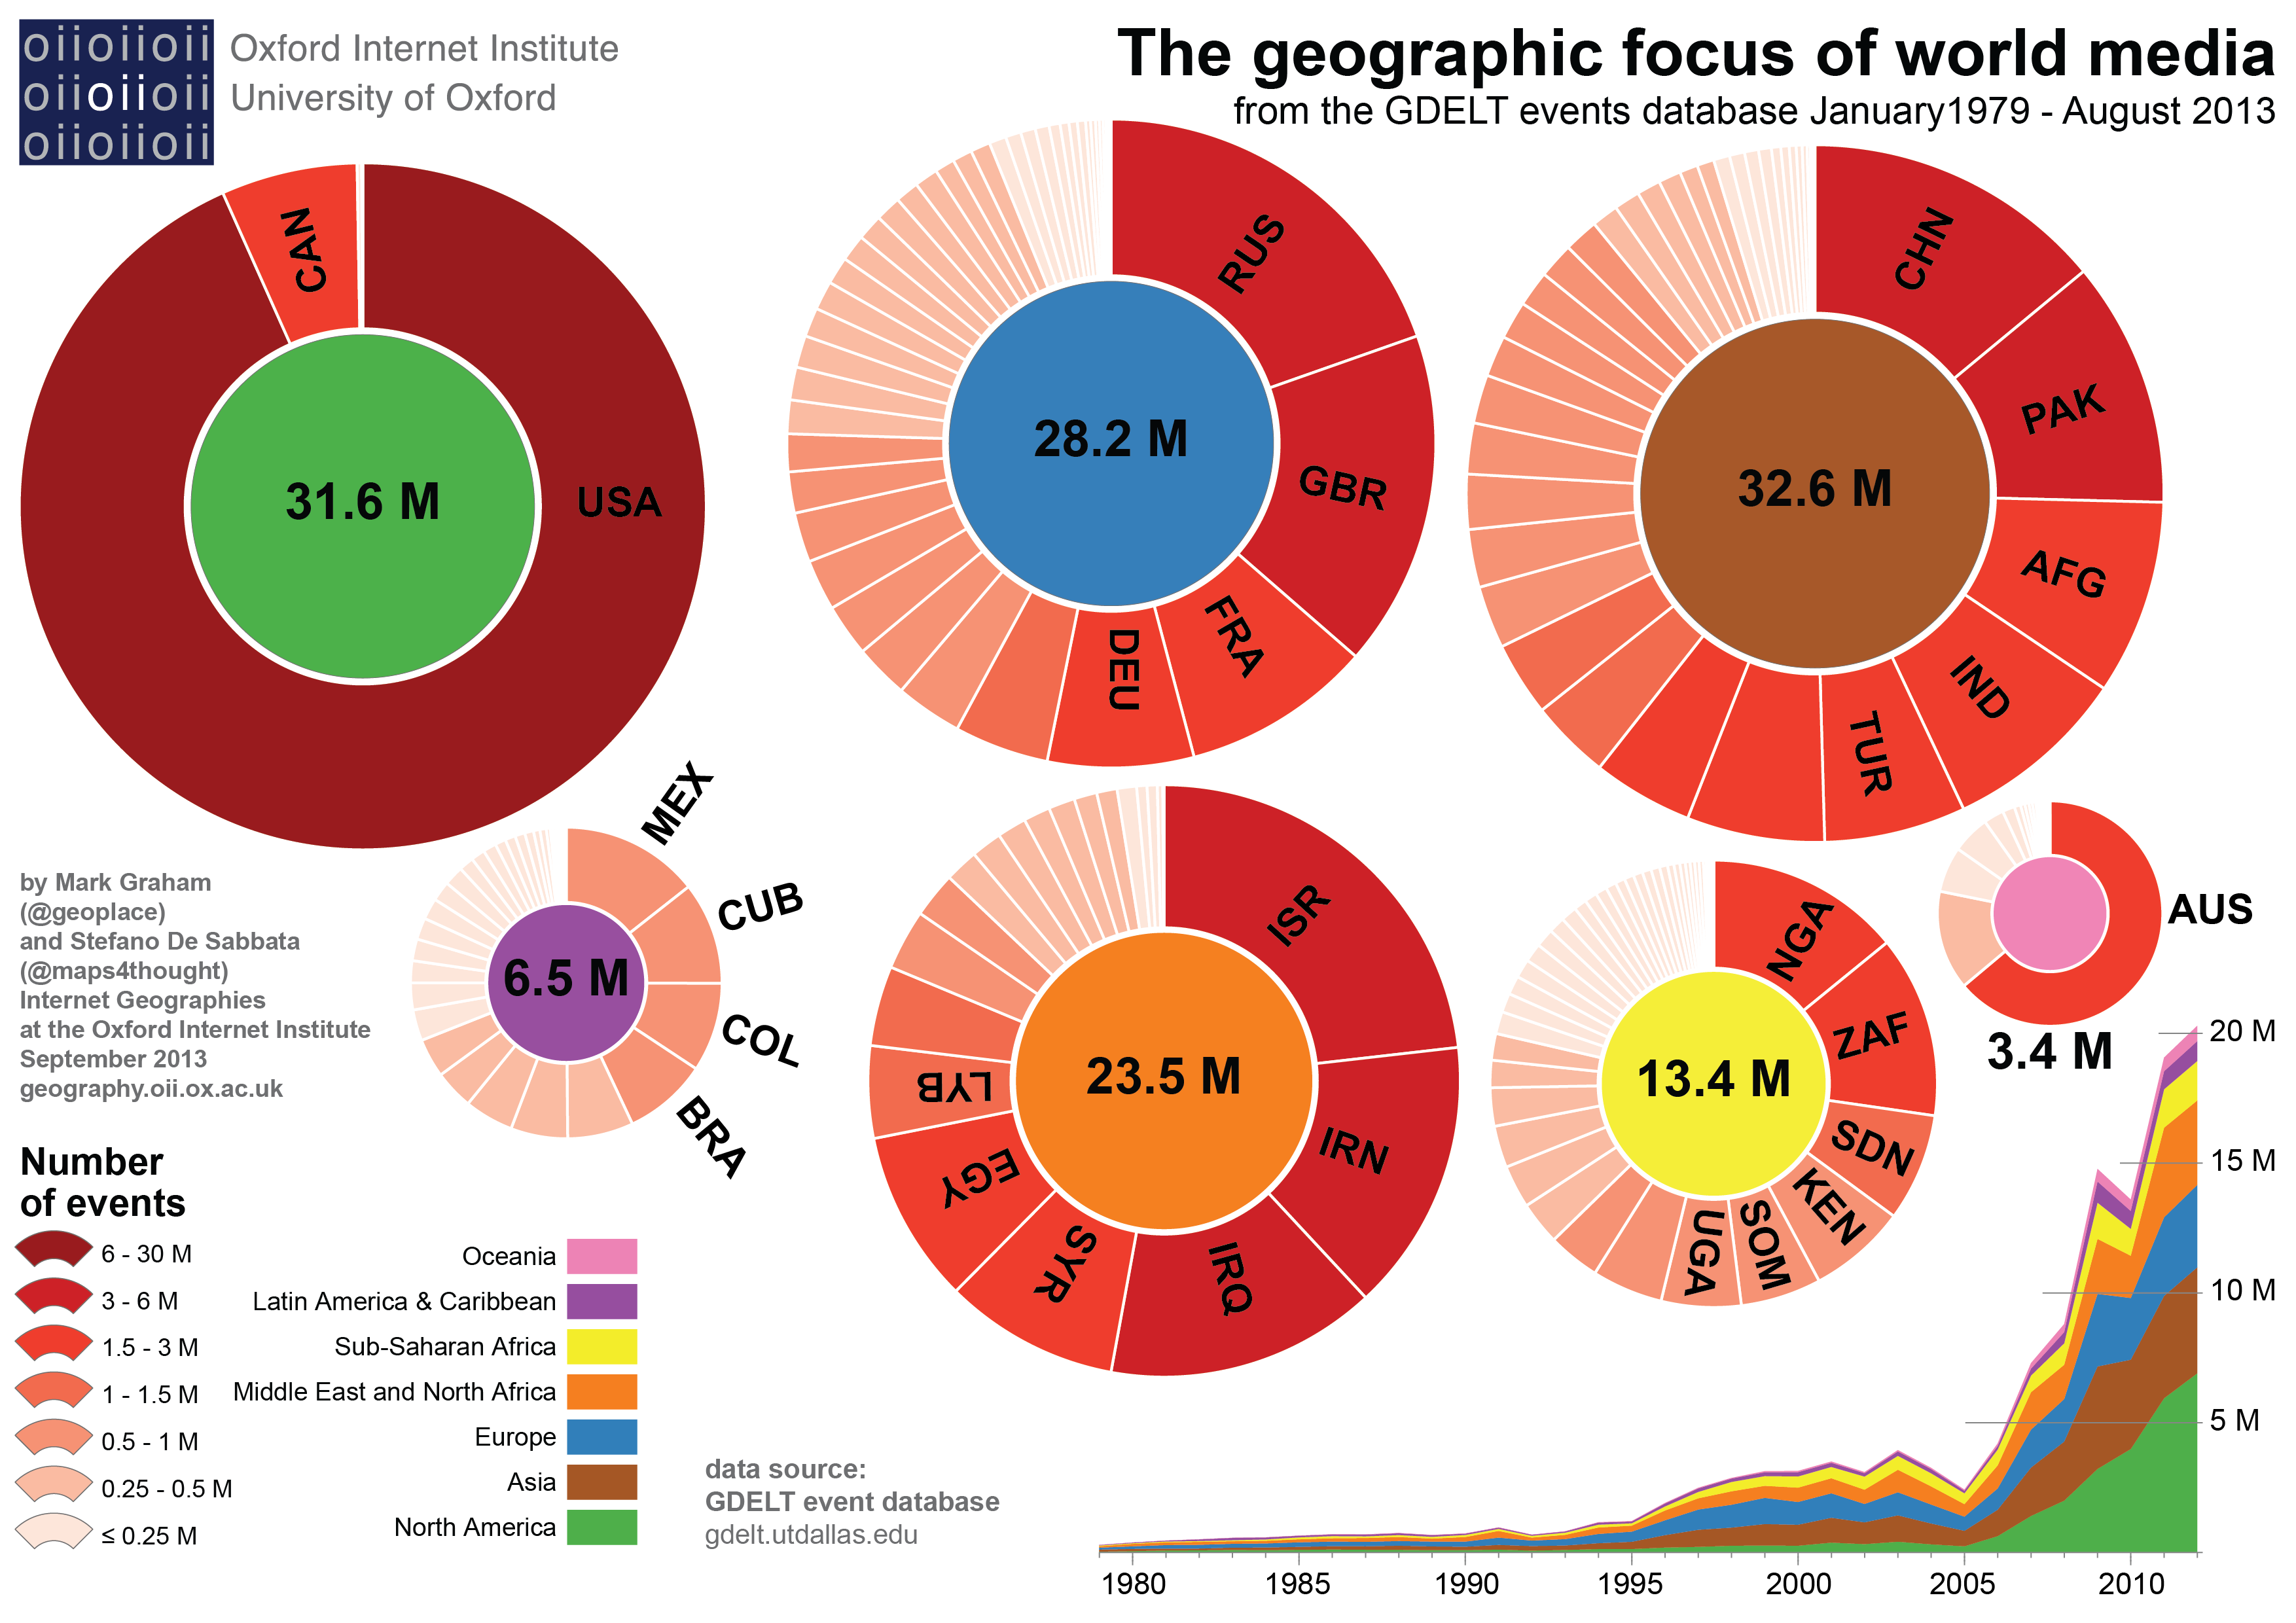
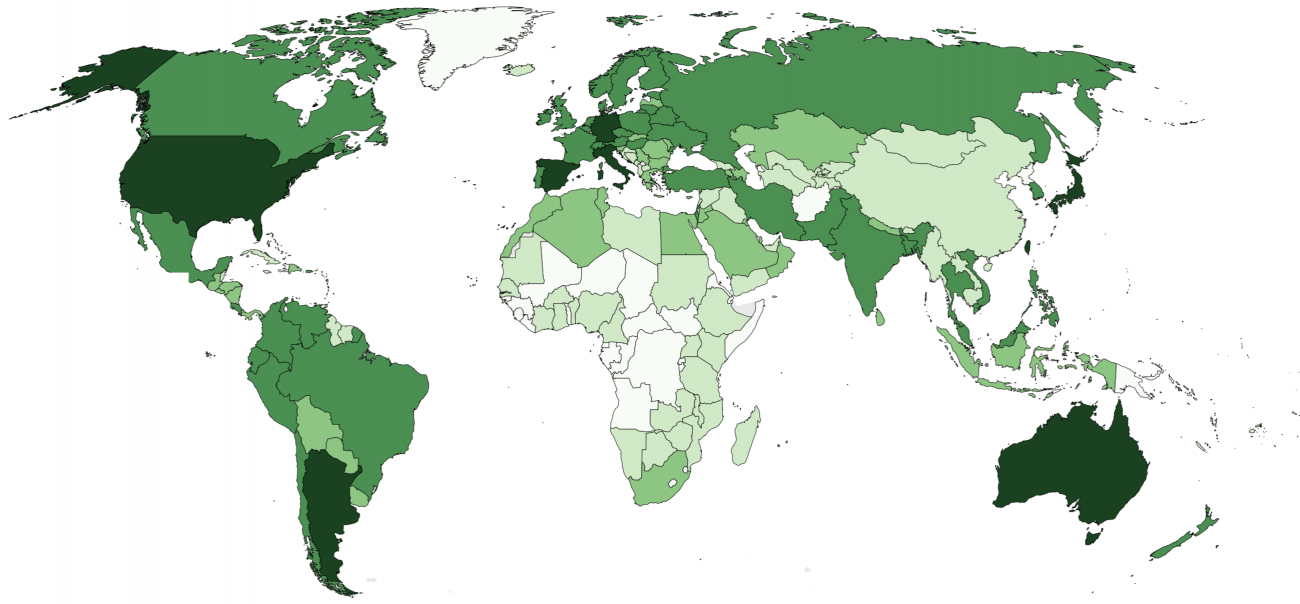
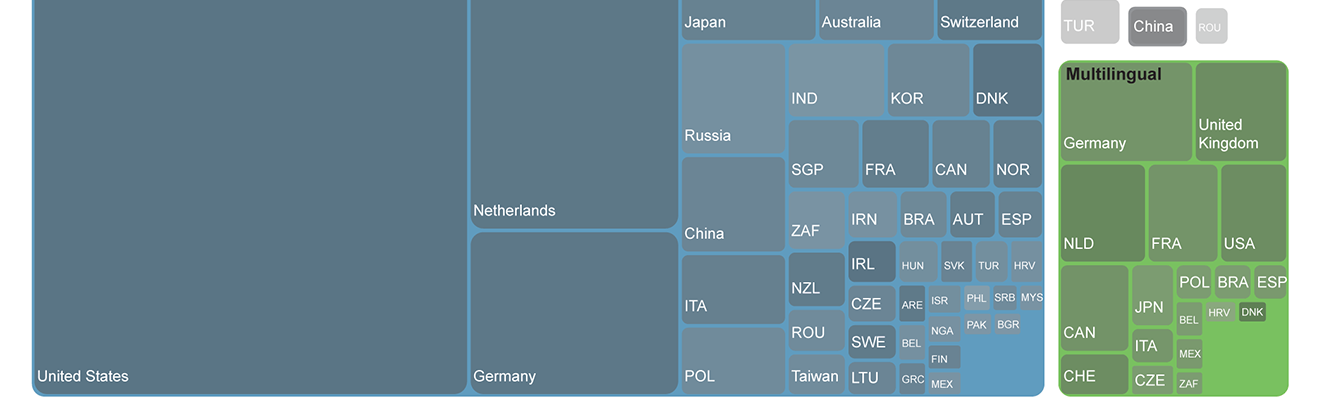
This graphic visualises those 140 million news events for which spatial data exists. In the map, each pie chart refers to a different world region. The shading of each country’s slice reflects the number of events recorded as happening in that country. The size of the pie represents the total number of events within that region, and the slices represent the relative percentage associated with each country. Also shown is a chart illustrating the number of events recorded in every year between 1979 and 2012.
Findings
News is one of the central ways that we learn about and understand our world. It therefore contributes massively to how we understand place.
Looking at the data, we see that most recorded news events for which we have geographic data are located in the northern hemisphere, with North America, Europe and Asia each individually accounting for more than 20% of the whole collection.
Most events reported in Europe are located in Russia or large western European countries (in particular, the United Kingdom, France, and Germany), whilst relatively little attention is devoted to other parts of Europe.
There are roughly the same number of events located in Asia as there are in North America, despite the fact that the population of Asia is about twelve times larger. China and India together only account for 23% of Asian events, despite being home to about two-thirds of Asia’s population. Smaller countries in conflict areas, such as Afghanistan and Pakistan, account for a similar amount of attention.
A similar situation can be seen in the Middle East and North Africa region. Long-standing conflict areas — Israel, Iraq, Iran, Syria, Egypt, and Libya — account for more than three-quarters of the news events referring to this region in the collection.
More neglected are most of the countries in Latin America. The region contains only a fifth of the number of stories as North America, despite having almost double the population. Countries in Sub-Saharan Africa similarly are home to a relatively small number of reported events: with most of what is written about focused on just a handful of the region’s 47 countries. Note for instance that we see relatively little content about ongoing, and costly, conflicts in the Democratic Republic of the Congo, despite the heavy focus on conflicts in other parts of the world like Israel/Palestinian Territories and Afghanistan.
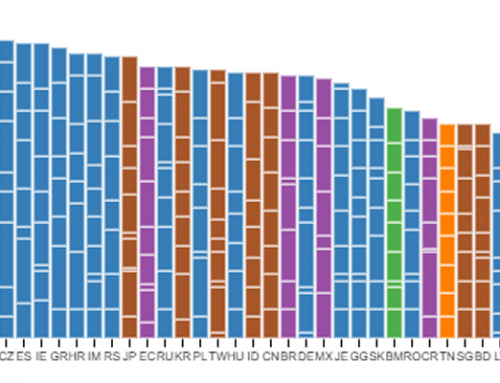
Also illustrated is the development of the GDELT dataset over time, from 1979 until 2012. We can see that the last five years account for the vast majority of the listed events.
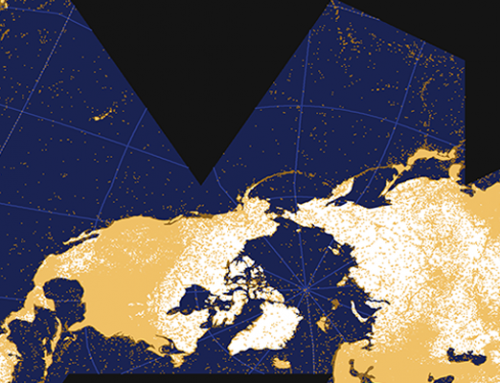
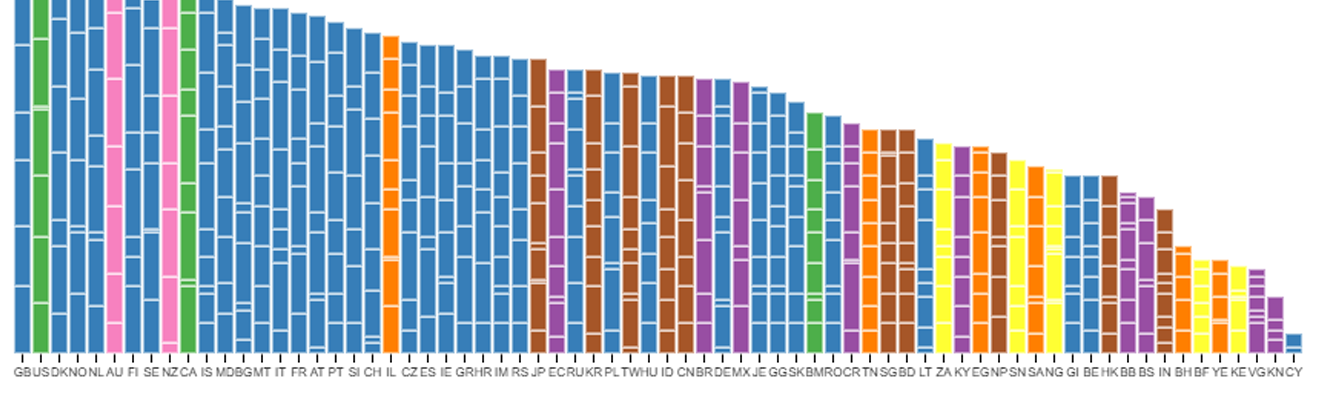
A finer-grained analysis of the geographic information reported in the dataset shows that 80% of the events are located in a short list of only 816 specific locations — scattered throughout the world. In other words, not only are the geographies of news highly uneven at the national-scale, but even within those places, articles tend to focus on only a small subset of locations.
News stories necessarily reflect underlying events and processes that have distinct geographies. Some of the distributions we see in these charts are undoubtedly artefacts of the gazetteers that have been used to geocode news events. We already discussed the uneven geographies of gazetteers, and it stands to reason that employing them to geocode news events will simply reproduce some of their underlying biases.
But irrespective of biases derived from the use of gazetteers for geocoding, the question that we ultimately have to ask ourselves is whether our media are presenting us with something resembling an accurate reflection of newsworthy events. This graphic suggests that may not be the case.