(Click to see full image)
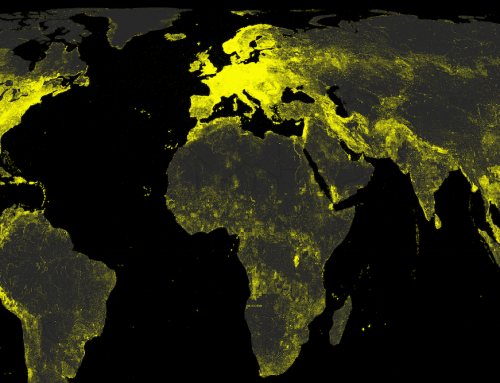
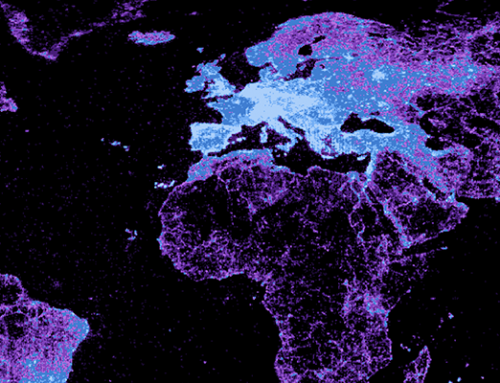
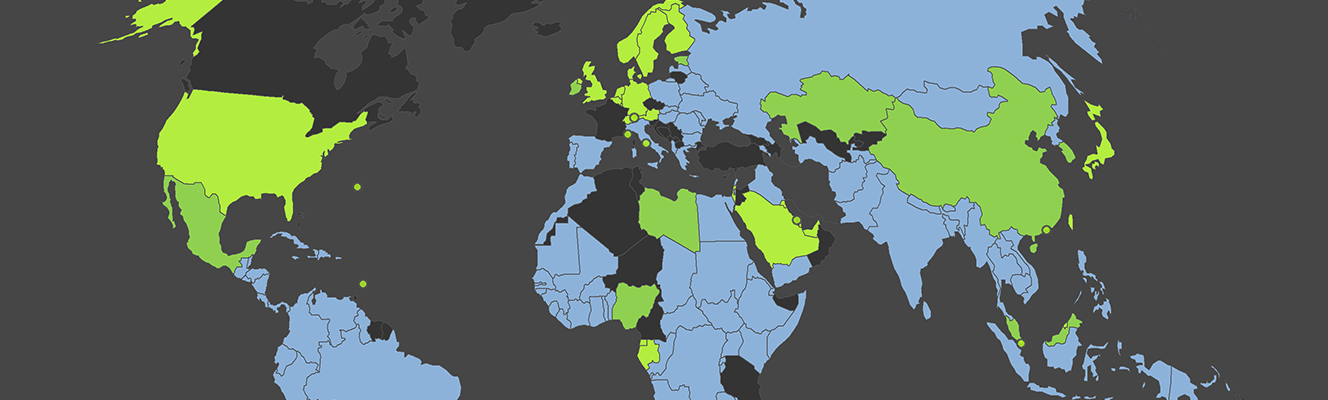
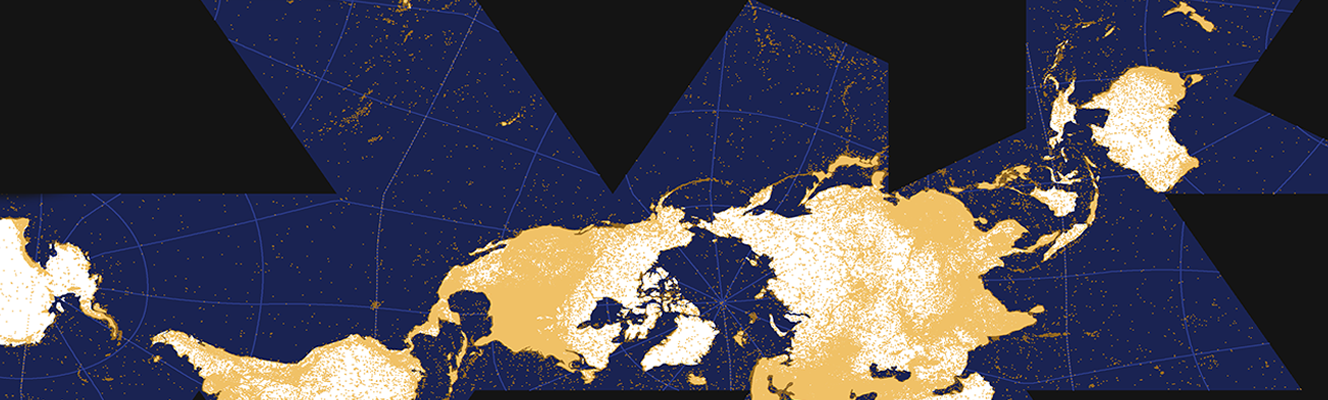
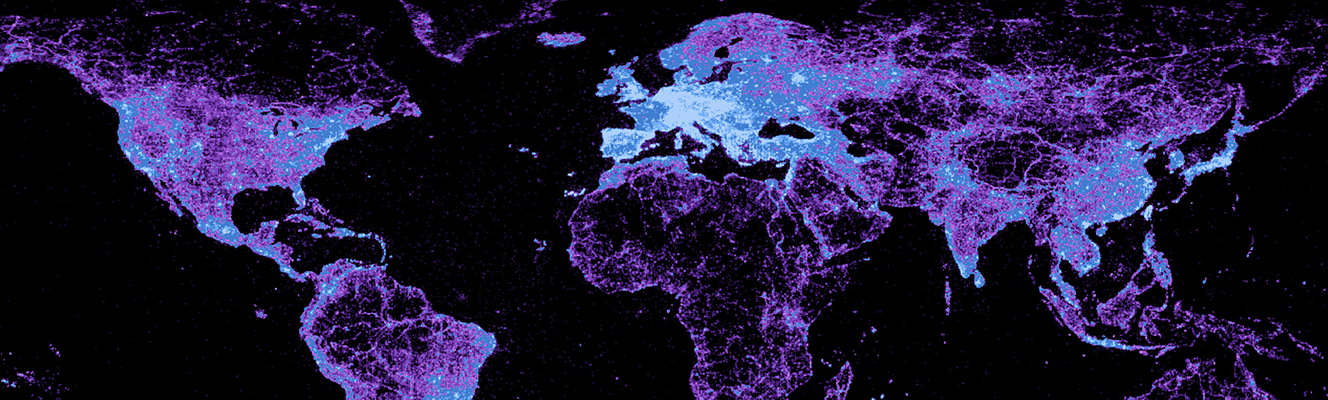
Wikipedia is one of the world’s largest and most important repositories of crowdsourced knowledge. This map uncovers the distinct geographies of that information.
Data
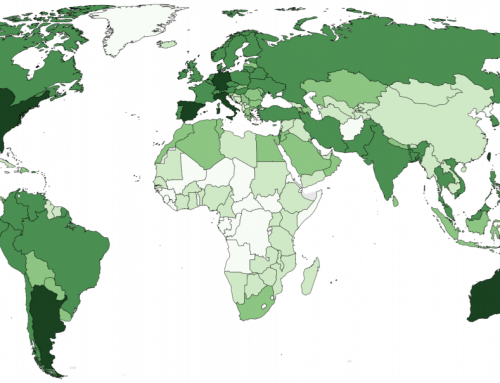
Most Wikipedia articles about places, events or any other locatable articles are geotagged with a pair of latitude and longitude coordinates. We downloaded the list of approximately 1.5 million articles from a 2010 database of Wikipedia and joined them to a file containing the boundaries of every country in order to determine the total number of geotagged articles in every country. Although not every article can be geotagged (e.g. there would be no reason to tag articles on ‘blueberries’ or ‘zombies’) there is no reason to assume that there is any systematic or geographic bias in the tagging of articles. The dataset that we are using contains geotagged articles written in any language version of Wikipedia.
Findings
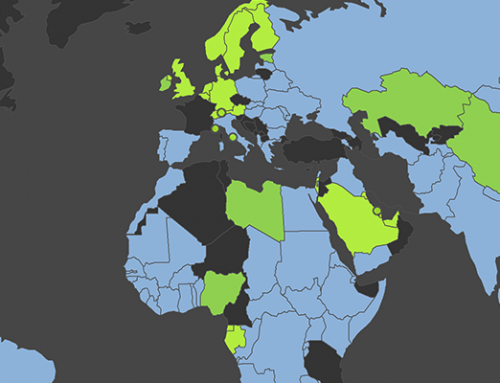
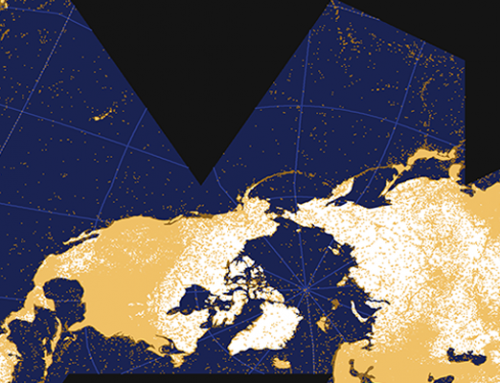
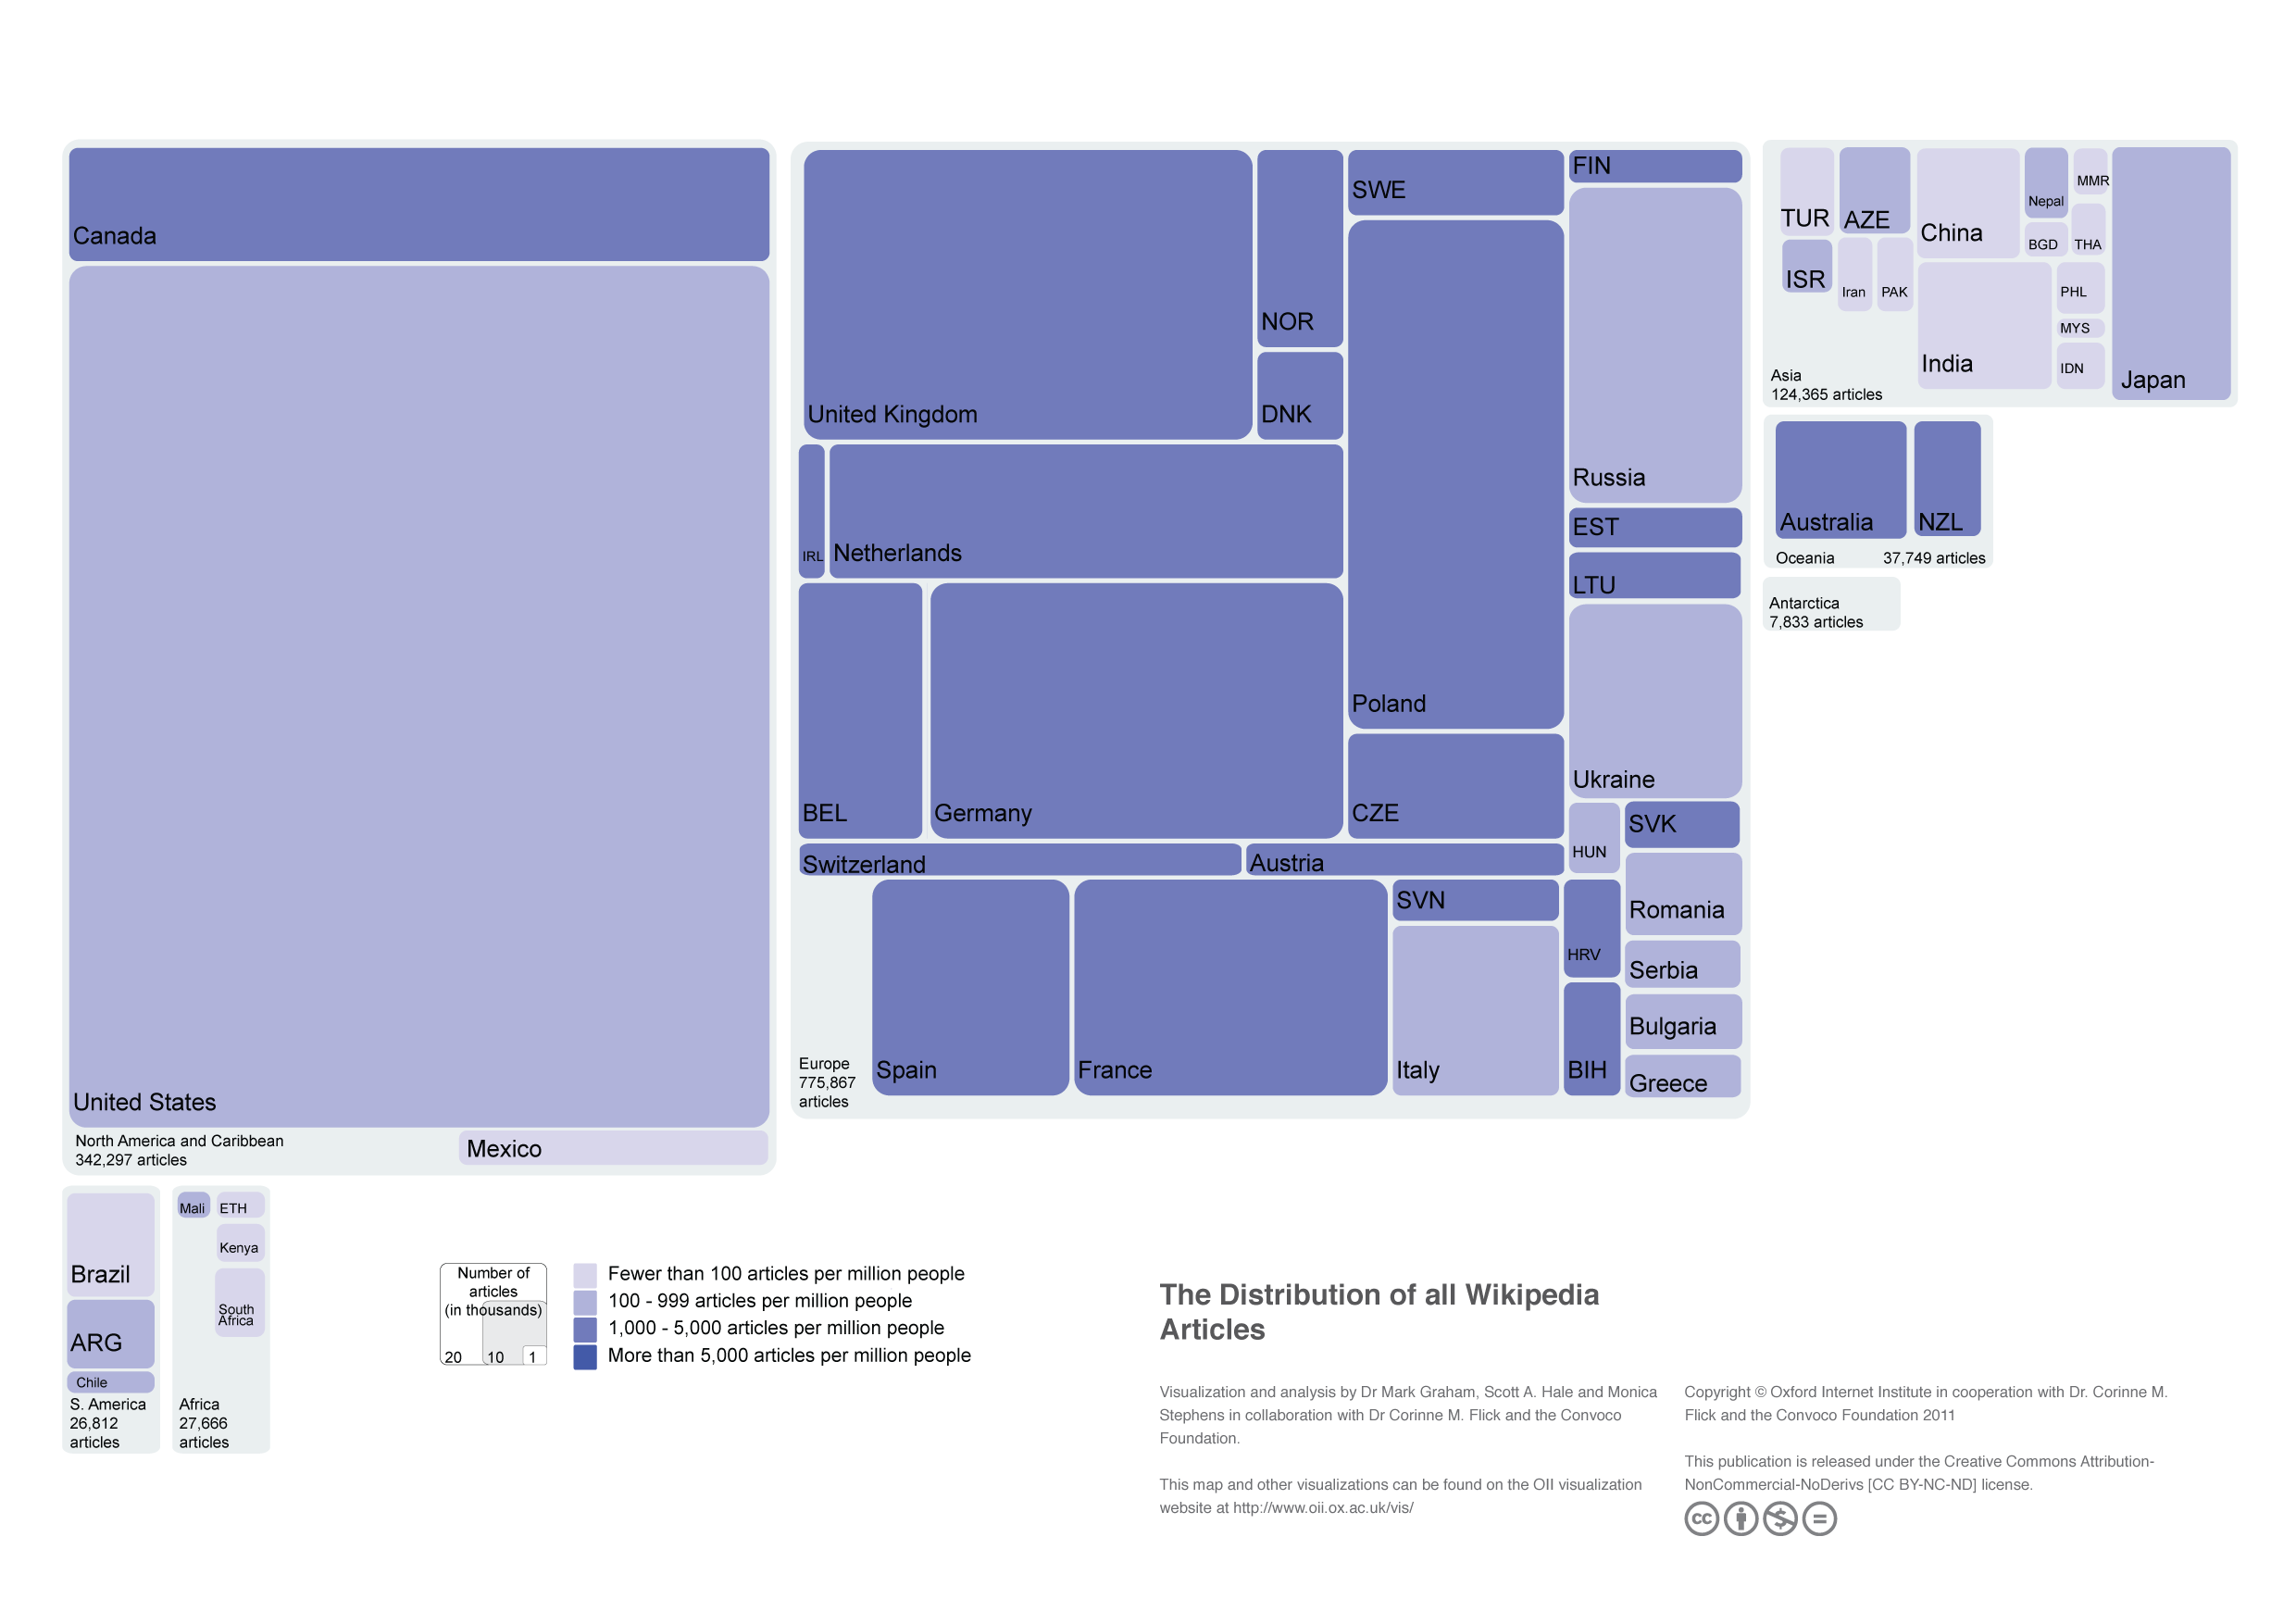
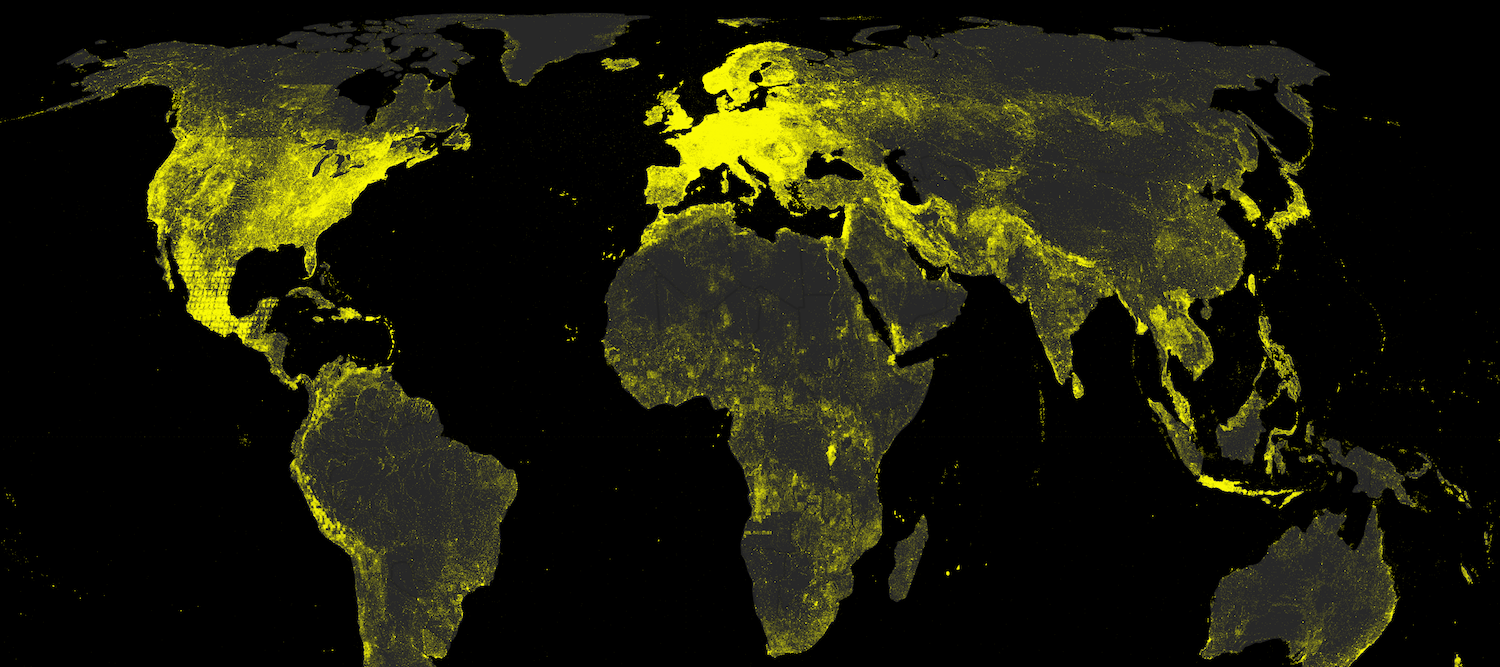
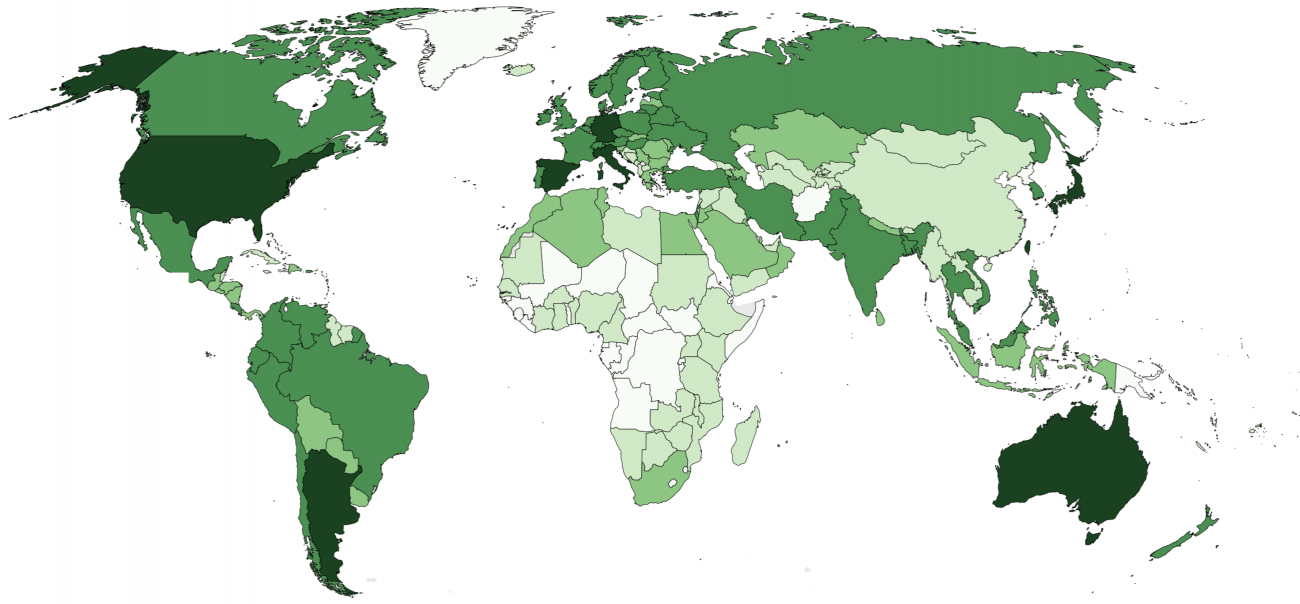
There is a clear and highly uneven geography of information in Wikipedia. Europe and North America are home to 84% of all articles. Anguilla has the fewest number of geotagged articles (four), and indeed most small island nations and city states have less than 100 articles. However, it is not just microstates that are characterized by extremely low levels of wiki representation. Almost all of Africa is poorly represented in the encyclopaedia. Remarkably, there are more Wikipedia articles (7,800) written about Antarctica than any country in Africa or South America. Even China, which is home to the world’s biggest population of Internet users and is the fourth largest country on Earth contains fewer than 1% of all geotagged articles. Because of the high visibility of Wikipedia in online information ecosystems, countless decisions are made and countless opinions are formed based on information available in the encyclopedia. It is thus important to point out the digital terra incognita that covers much of the world and reproduces existing representational asymmetries.