(Click to see full image)
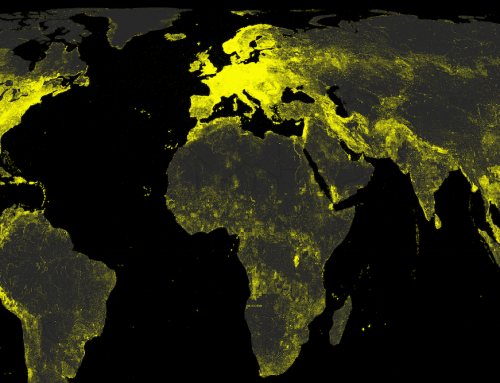
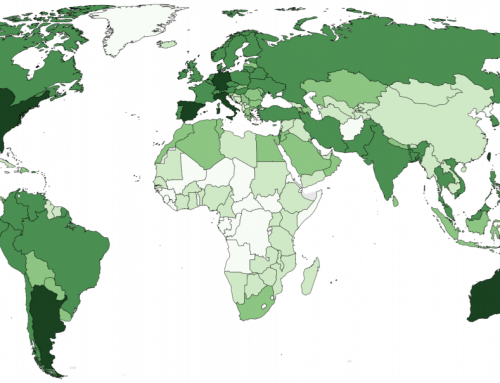
This graphic maps a combination of generic top-level domains (gTLDs) and country code top-level domains (ccTLDs) in order to provide an indication of the total number of domain registrations in every country worldwide.
Data
The graphic is based on data collected in 2013, and provided by Professor Matthew Zook (University of Kentucky). It also uses 2011 population and Internet penetration data from the World Bank (the same data we employed in our visualisation of Internet population and penetration).
All gTLDs are mapped through an analysis of information returned by the WHOIS Internet protocol, that provides contact information for any given domain. For instance, this meant that for every .com domain name, the location registered in that domain’s WHOIS data was retrieved and stored in a database.
The gTLD country-level data are supplemented with the number of ccTLDs that can be associated with each country. Here we operate under the assumption that in contrast to gTLDs, most ccTLDs will be registered and used by people in the country associated with it. For instance, we assume that a majority of .fr domains are used in France and a majority of .za domains are used in South Africa.
In making this assumption, we have also taken care to remove all ccTLDs that function as de-facto gTLDs from the map. This has meant removing the following ccTLDs:
- .tv (Tuvalu): used by the media industry
- .fm (Federated States of Micronesia): used by the media industry
- .am (Armenia): used by the media industry
- .mu (Mauritius): used by music websites
- .ac (Ascension Island): used by education-related websites
- .re (Réunion): used by real-estate agents
- .ws (Samoa): used as an abbreviation for “web site”
- .me (Montenegro): used for personal websites
- .cc (Cocos Islands): used as an alternative to .com (administered by VeriSign)
- .cm (Cameroon): used as an alternative to .com (as a way of exploiting typing errors)
- .nu (Niue): means “now” in Danish, Dutch, and Swedish
- .as (American Samoa): the suffixes “AS” and “A/S” are used in some countries (e.g. Norway, Denmark, and the Czech Republic) for joint stock companies
- .io (British Indian Ocean Territory): used by start-up companies
- .st (São Tomé and Príncipe): is used around the world in several ways
- .tk (Tokelau): the .tk domain can (unusually) be registered for no monetary cost. This has meant that there are over 17 million domains registered to the country (which is more than the total registered in the UK).
We have included the following ccTLDs, resized according to estimates reported on Wikipedia:
- .co (Colombia): used as an alternative to .com (as a way of exploiting typing errors)
- .md (Moldova): used by medical doctors
The graphic also excludes all countries that contain fewer than 10,000 domains.
Despite these exclusions, we would maintain that this method offers the most comprehensive overview of the geography of top-level domains.
Findings
The cartogram illustrates that a majority of domains (78%) are registered in Europe or North America: a finding that reinforces the dominance of those two regions in terms of Internet content production. Asia, in contrast, is home to 13% of the world’s domains while Latin America (4%), Oceania (3%), and the Middle East and Africa combined (2%) have even smaller shares of the world’s websites.
Globally, there are about 10 Internet users for every registered domain. However, we see a significant standard variance from that number, and the relation between number of registered domains and Internet population seems to be bipartite. On the one hand, it is quite common for European and North American Internet users and companies to register a domain name; in the Netherlands and Switzerland, we see as few as two Internet users per domain. On the other hand, registering a domain name is relatively rare in much of the rest of the world. In most of the Middle East and Africa, we see over 50 Internet users per domain.
The United States is home to almost a third of all registered domains, and has about one website for every three Internet users. China, in contrast, can boast the world’s largest Internet population, but has only one registered domain for every 40 Internet users. In fact there are fewer domains registered in China than in the United Kingdom: which has about one tenth of China’s Internet population.
More broadly, Asian countries tend to have relatively low numbers of registered domains compared to European countries with similar Internet populations. Japan is home to twice the number of Internet users as the UK, but hosts less than one third of the number of British websites. Italy and Vietnam have almost the same Internet populations, but Italy is home to more than seven times the number of websites. Uzbekistan has more Internet users than Switzerland, but not even one percent of the number of Swiss websites (likely as a result of the extensive Internet censorship in operation in the country).
Interestingly there is a significant positive correlation between a country’s rank in Gross National Income (GNI) per capita, and the number of domain names per Internet user. A country’s ranked position by GNI per capita explains about 50% of the variance in its ranking by number of domain names per Internet user.
These data offer a fascinating window into one important facet of Internet content production. We see that large Internet populations in some countries (e.g. China) are not necessarily indicators of large numbers of domain registrations. In other words, just because a country is home to a large number of Internet users, doesn’t necessarily mean that it is also home to an active group of content producers. However, it is also likely that we see a lot of the world’s content simply placed within websites that are hosted within only a few countries (in particular, the US).
Yet it remains that, as we also see with other metrics (such as Wikipedia articles vs. edits), amongst those that are online, some countries are producers of large amounts of content whilst others remain largely consumers.
See also: Zook, M.A. (2001). Old hierarchies or new networks of centrality? The global geography of the internet content market. American Behavioral Scientist 44 (10) 1679-1696.
