(Click to see full image)
This is a visualization of the requests Google receives “from government agencies and courts around the world to remove content from [Google’s] services or to review such content to determine if it should be removed for inconsistency with a product’s community policies”.
Data
The data have been released by Google every six months since July 2009. However, the company does mention that there are some unspecified limitations to the data that they release. This in an alternative visualization to the map included in the report published by Google.
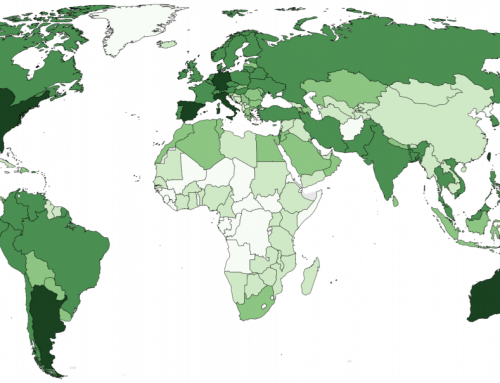
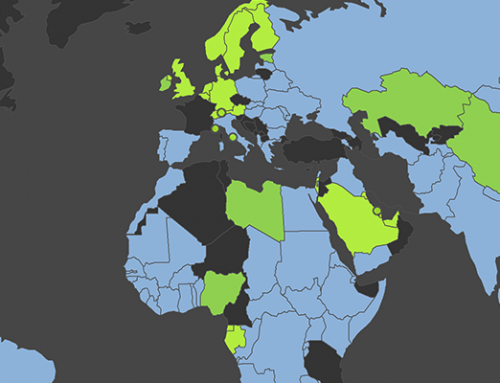
The data are presented as an interactive choropleth map. Color shades are used to represent three types of information (which can be chosen using the dropdown menu on the bottom-right): the number of removal requests (blue), the percentage of requests complied with (green), and number of removed items (red). A slider on the top-right allows the user to select the time period to be visualized. The “play” button can also be used to animate the map, showing change over time.
Findings
Although the number of content removal requests submitted from governments to Google varies over time, there are some clear patterns in the data. Some countries consistently submit large numbers of requests. Indeed, when ranking countries by number of submitted requests, we see a strong statistical correlation (p<.01) between the country’s rank for a six-month period, and the rank for the next one. In fact, when ranking the total number of removal requests, there are six countries that always appear in the top-10 list.
In almost every six-month period, Brazil is the top-ranked country. The Knight Center for Journalism in the Americas of the University of Texas at Austin reports that “the 2012 [Brazilian] elections contributed to the alarming rise, up to 316 requests–almost a half of the total–related to supposed violations of the Brazilian Elections Code. YouTube was the most targeted service for censorship requests” and that “the director of Google Brazil went to jail for refusing to comply with a court order to remove videos a mayoral candidate considered offensive” (see original article by Terra, in Portuguese).
The United States and Germany are commonly found between second and fourth position. India, the United Kingdom, and Spain, are also persistent requesters of the removal of large amounts of online content. Most of the requests from these countries concern Web searches and Google Groups content. In its own blog, Google comments that the period July-December 2012 represented a peak in the number of countries submitting removal requests, particularly court orders to remove “blog posts criticizing government officials or their associates”. YouTube is also among the most targeted service, with 2328 videos removed as a result of requests by India in that period, due to religious offence.
Of those six countries that issue consistently large numbers of removal requests, it is interesting to note that we see extremely large differences in the percentages of requests that are complied with. Germany always has a high percentage of requests complied with (usually over 80%), Spain always has a low percentage (usually about 30%), and Brazil, the United States, India, and the United Kingdom have seen a significant decreasing percentage of requests that are complied with, from about 80% in 2009 to about 40% in 2012. This trend might be explained by a general increase in the number of requests coming from these countries. For instance, in the autumn of 2012, Brazil made more than three times as many requests as in the spring of the same year (and the percentage of requests complied with dropped from 55% to 21%).
When looking at the total number of removed items (i.e. the single pages, documents, images, or videos, that Google actually took out of their search results), we rarely see more than a few thousand items removed per country in each six-month period. However, there are a few exceptions. The United Kingdom managed to get almost 100,000 items removed from Google AdWords in the second half of 2010, after two requests from the UK’s Office of Fair Trading regarding fraudulent ads that linked to scams (despite concerns raised by the Time). Similarly, Brazil was able to get 40,000 images removed from Picasa Web Albums in 2010, as these were pages from copyrighted books, and South Korea obtained the removal of 32,000 search results in 2010, that contained unique resident registration numbers.
Two other noteworthy cases are Turkey and Libya. Turkey has seen a rapid increase in removal requests starting from the first half of 2011. It became the top-ranked country for number of requests in the first half of 2012, asking Google to remove 426 YouTube due to “alleged criticism of Atatürk, the government or national identity and values” and several blogs for “discussing minority independence and disclosing details about the private lives of politicians”. Libya made it to the top-10 list of requesting countries in both halves of 2010 (immediately prior to the country’s civil war in 2011), asking Google to remove more than 1000 YouTube videos.
Unlike many of our other maps, these visualizations attempt to show absences rather than presences. They give us a sense of the scale at which some governments and private entities work to actively remove content from the Internet. Furthermore, they reveal that those attempts to hide content have distinct geographies; not only are some parts of the world much more active in policing the Internet, but some are simply more successful at it.
