(Click to see full image)
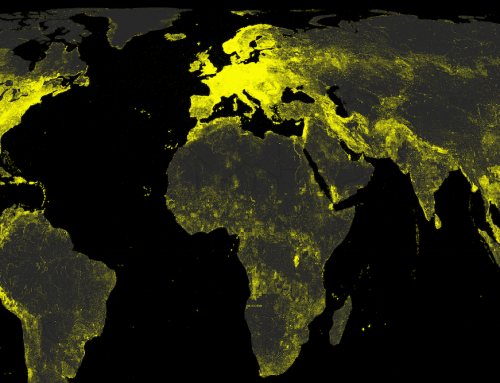
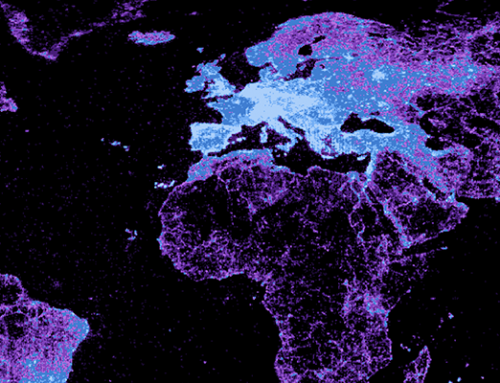
Knowledge indexed by Google plays a key role in how we perceive our material, offline environment. This map visualises the amount of user-generated content indexed by Google in 2009 in a sample of 250,000 points around the world.
Data
In order to measure the amount of user-generated content indexed by Google in each country, a dataset was created based on a 0.25 x 0.25 degree grid of all the land mass in the world (roughly 250,000 points). A buffer was then constructed for each point using a sliding variable size based on the great circle distance to neighbouring points in the grid pattern. It was important to adjust this value in order to compensate for decreasing distance between longitudes as the software moves from the equator to the poles. For each point and buffer combination a search was run in Google Maps to measure the total number of hits for user-generated content at each location (as defined by Google).
Findings
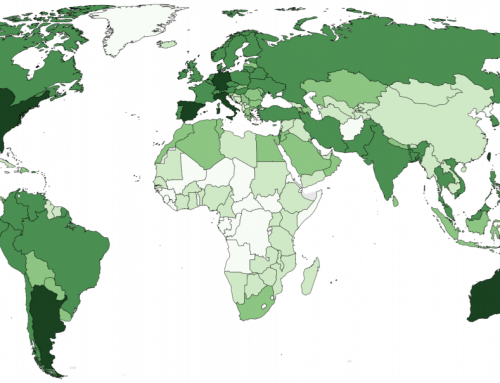
This graphic highlights the staggering amount of unevenness in the production and dissemination of information. The United States, and to a lesser extent Europe and Japan, are home to the bulk of the world’s content (90%). The poor rankings of some countries are undoubtedly due to censorship or competing platforms, but even in the rest of the world we see that large swathes of territory unambiguously have very little content created about them. We can therefore see that user-generated content is far from being a simple mirror of either population density or human activity.
